off the top of my head, we need to reprsent the layout into a graph and simply treat the problem as traveling salesman issue
Completely agree and I think that would be an amazing feature for a WMS system. I don’t know of any open-source systems that support that out of the box (maybe OpenWMS.org). There are definitely commercial systems that do this, but those might be cost-prohibitive.
We could probably do this without needing a visual design tool to represent the warehouse layout.
There are two parts to the problem:
- Determining how to breakdown your storage locations into priority/fast-mover bins vs other bins
- Determining what stock items are high priority vs low priority
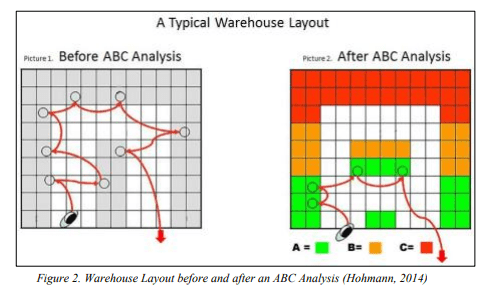
As a first step, we could draw the storage layout using lo-fi graphing paper (or use an online system like smartdraw.com or lucidchart.com) to represent a few warehouse layout designs. Then you might want to assign some type of weighting to your bin locations (maybe distance from a staging area). You might also want to include any important characteristics of your bin locations like weight and volume restrictions. I would include the volume and weight filtering since some bin locations might not be able to support certain products so you don’t want the algorithm to place items incorrectly. You can label each area with an ABC classification that would give you a very broad breakdown. The hard part here is that we’ll need to do some more calculations later to determine what can actually fit in certain areas of the warehouse before the ABC classification is actually useful. For sake of argument, let’s assume all items are the same weight and volume. Eventually you might get something that looks similar to the image below.
The next step would be to compile some order data to see what items are most important. This will be entirely up to your operation. In a warehouse with global health commodities (which is a use case that I’m most familiar with) I might prioritize consumable products that are high usage like Exam Gloves and Sutures, high usage drugs like Acetaminophen, Ibuprofen or Oral Rehydration Salts (ORS) as well as low usage, but highly essential medicines like ARVs or tuberculosis prophylaxis. Or it might be prioritized by the funding agency that is paying for the warehouse. So I have a few dimensions that I might need to account for with my products … namely, usage, essentiality, and cost. But again, it’ll be up to you. Maybe you’d like to use # sales or sales amount. Or a combination. In the case of a combination you’d need to come up with an algorithm to weight the multiple dimensions appropriately into a combined score. So no matter what you decided to do you’ll eventually have a table like the one below.
In order to make this example straightforward, let’s just take a very simple statistic like number of transactions the SKU was involved in during some period. The following table represents the total number of transactions by SKU and the calculations needed to breakdown the items into an ABC classification.
| SKU |
Total |
Cumulative |
Percentage |
ABC Classification |
| 10001 |
1000 |
1000 |
37.52 |
A |
| 10002 |
750 |
1750 |
65.67 |
A |
| 10003 |
500 |
2250 |
84.43 |
B |
| 10004 |
250 |
2500 |
93.81 |
C |
| 10005 |
100 |
2600 |
97.56 |
D |
| 10006 |
50 |
2650 |
99.44 |
E |
| 10007 |
10 |
2660 |
99.81 |
E |
| 10008 |
5 |
2665 |
100.00 |
E |
| 10009 |
0 |
2665 |
100.00 |
Obsolete? |
In case it’s not obvious, to get the percentage we divide the Cumulative (1000) and by the last Cumulative (2665) to get the Percentage (37.52%). We can then use whatever breakdown we want to assign the ABC classification. I figured the breakdown should follow the Pareto principle where my top 80% would be in an A location, B items would be in a less prioritized (but still optimized) location and the rest would be wherever.
- A (80%)
- B (85%)
- C (95%)
- D (99%)
- E (100%)
This is an approximation of the ideal order picking algorithm you mentioned above but it probably gets you 95% of the way to a solution with much less complexity.
However, let’s keep talking about a nearest neighbor solution because I think that would be really awesome to support in a future version of OpenBoxes.
In either case, the algorithm we choose to go with needs to be incorporated in your warehouses’ standard operating procedures and therefore probably needs to be run every so often (once a year, every few months) in order to make sure your fast movers / essential stock are being placed in the right areas and that the less important or obsolete stock items are moved out of your priority bins or removed altogether.
Anyone have any thoughts?
Disclaimer: I am not a warehouse storage layout expert so please take these suggestions with a grain of salt. With that said, I love these kinds of conversations and want people to feel comfortable asking them in this forum. I think we can attract a wider audience if we can broaden our conversations to topics outside of what the software supports. So thank you @Lukeliush for this question!!!